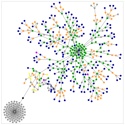
 websitegraphs lets you visualize a site through a system of dynamically arranged clusters, color coded to describe links, divs, images, line breaks, and other tags. Pictured here is this weblog, but every site graphed looks radically different. More fun than looking at the static images is watching a site being clustered in real-time – the animation is seductively elastic.
via mandric

Along the same lines you might want to check out SiteOrbiter at siteorbiter.cc.
Well that IS cool. :) Thanks!